How To Use The Sales Trend Analysis Grid
From Season 17 onwards, a new trend analysis grid for customer sales now exists. This allows further analysis and breakdown of trends for certain customers over a period of 12 weeks/months or days.
- On the reports menu go to the Sales Analysis -> trend analysis.
- Customers data will be displayed in the top grid and product details will be displayed on the bottom grid.
- You can to choose to use a query or choose to report by Area, Currency,Customer,head office, Market, Rep, route and sort keys from the drop down menu.
- Once you chose how you want to report by you will need to adjust your selection. If you chose to report by customer you can change the selection for which customers you want to appear in the grid. (All customers or a single customer)
- Next you can select the time period for which the analysis is based upon the options are months, weeks or days. Furthermore, the ability to select up to a period is provided for each of the date options.
- The trend setup function gives you the ability to control how many time periods you want to compare against each other. To adjust this grab the needle and drag it back or forward. Your ‘Base Cols’ will be the base time period against which you compare and the ‘Comparative Cols’ will be the period to compare against.
- Clicking the load data button will display the relevant data in the trend analysis grid.
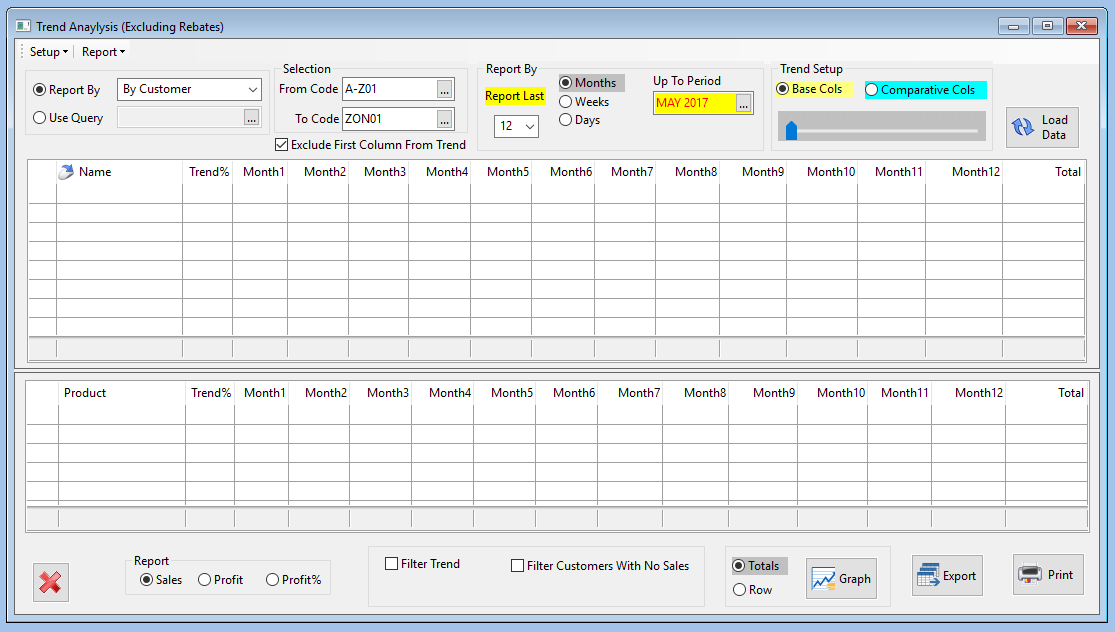
- At the bottom of the window you can select to report the sales, profit or Profit%. Selecting one of these will instantly change the data displayed on the trend analysis grid.
- By using the ‘Filter Trend‘ you can choose to see only figures greater or less than the desired amount.
- There is also an option available to filter customers with no sales, this will identify trends in customers not buying.
- The data can be presented in a graph by clicking the graph button
- By clicking the export button you can choose to export the data to a CSV file. When you have chosen the settings, click the print button at the bottom right hand corner of the screen and your report will be produced.