How to create a Season query report.
Season offers multiple pre-defined reports that can be run to get information from across all areas of your business but sometimes you may find the pre-defined reports don’t show you exactly what you want to see. If you cant find a suitable pre-defined report, Season gives you the ability to create your own bespoke reports.

To create your own query you need to open the creation program by selecting Season Query from the Office Tools menu found by clicking on the Season icon from the top tool bar.
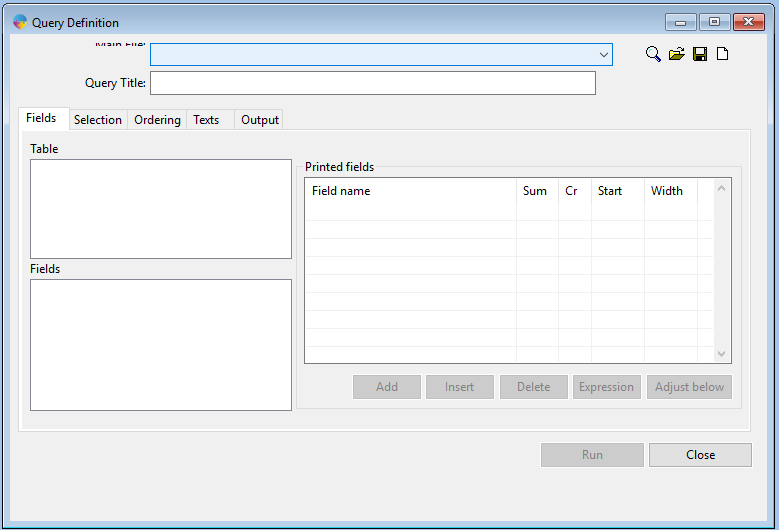
The first step in building the report is to select the main table you want to get your information from. Click the top drop down box to view a list of tables and click on the one you want to use. As an end user, you may not be 100% sure what table to use, below I have listed a few of the more commonly used tables.
- Custmast(300) – Main Customer information table
- Ordrhead(45) – Sales Orders Header table
- Ordrtrxs(46) – Sales Orders detail table
- Salefile(310) – Posted Sales invoices header table
- Saletrxs(315) – Posted Sales invoices detail table
- Cashhead(355) – Receipts header table (Customer and nominal receipts)
- Cashtrxs(360) – Receipts detail table (Customer and nominal receipts)
- Pricbook(90) – Pricebook table
- Creditor (400) – Main Supplier information table
- Stocporh(145) – Purchase order header table
- Stocpord(27) – Purchase order detail table
- Purchead(410) – Purchase invoice header table
- Purctrxs(415) – Purchase invoice detail table
- Paymhead(455) – Payments header table (supplier and nominal payments)
- Paymtrxs(460) – Payments detail table (Supplier and nominal payments)
- Custpart(205) – Main Product information table
You will now see your table, along with any related tables listed in the table box and the fields within this table listed in the fields box below that. You are restricted to building the report using fields from the tables that are displayed, if you need information that is not contained within the table/s that load upon selecting your main table, unfortunately there is no way around this.
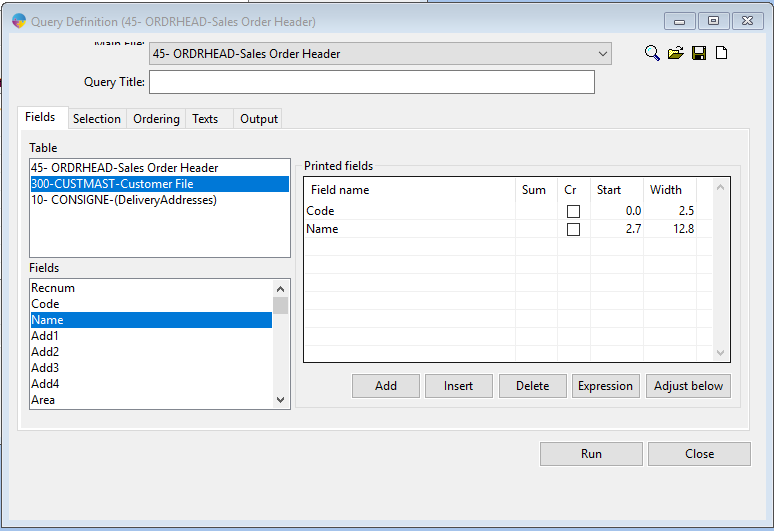
The next step will be to add in the fields you wish to view on the printed report. To do this, double click the field name and it should appear in the printed fields box to the right. When you have select all the fields you require, move onto the selection tab.
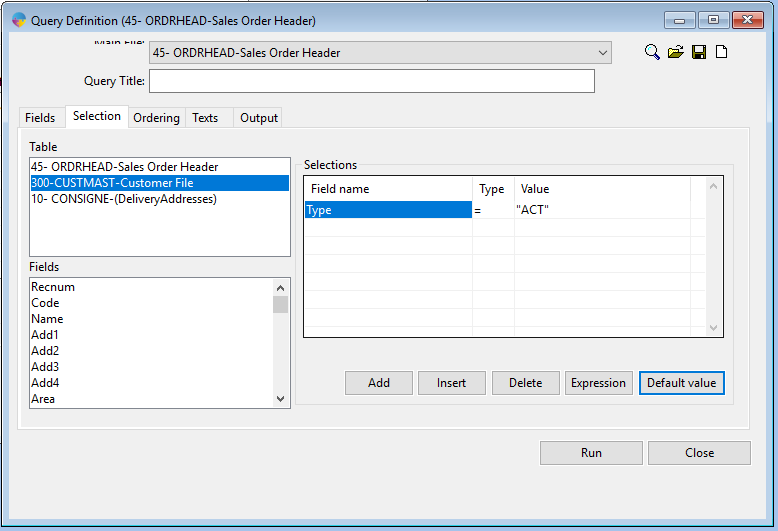
The selection tab is used to enter your selection criteria, running the report for a specific date range or running the report to see information on one or all customers for example.
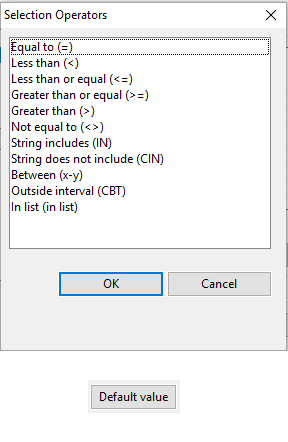
Double click the required field to select it, select a type (equal to, between x-y etc.) and click OK. To edit your selection criteria, click the Default Value button and enter in your values and click OK.
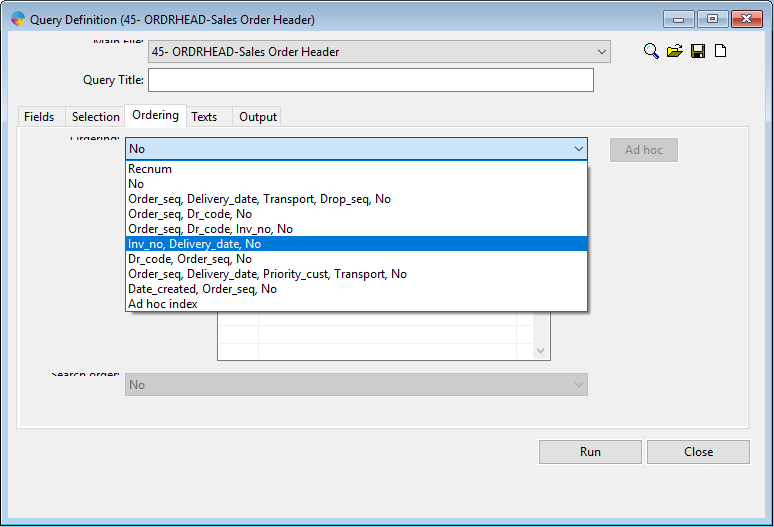
Moving on to the Ordering Tab, from the drop down menu you can select one of the pre-set orders or make your own using the Ad Hoc option. You will want your ordering to include one of your selected fields, preferably a unique field if possible. Doing this will help with the speed your query runs.
The next tab across is the Texts tab, here you can enter in any text that you want to have displayed at the start or end of the report.
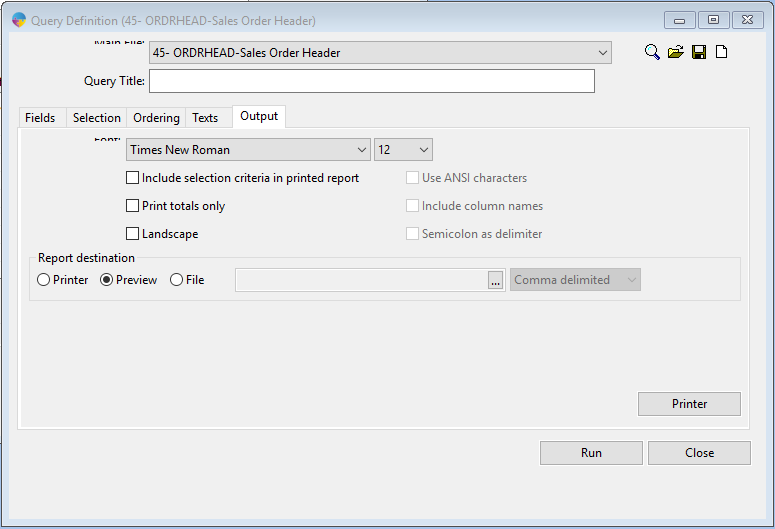
The final tab is the Output tab. This is where you can do a bit of formatting, including font, text size and page orientation. This is also where you will chose how your report is output. Once you have complete all the above steps you will want to run your report, click here for a guide on how to run your query report.