Comparative Analysis Grid
In Season 23 we have add a new feature to the comparative report which is the ability to view this information in grid format along as your season database is in SQL. It is a faster method of comparing two periods opposed to printing off paper/pdf copies of the report although at the bottom of the Grid there is the option to print of the report in a more detailed version. There is now an export button so you can export the data on the grid directly to excel for your own data manipulation.
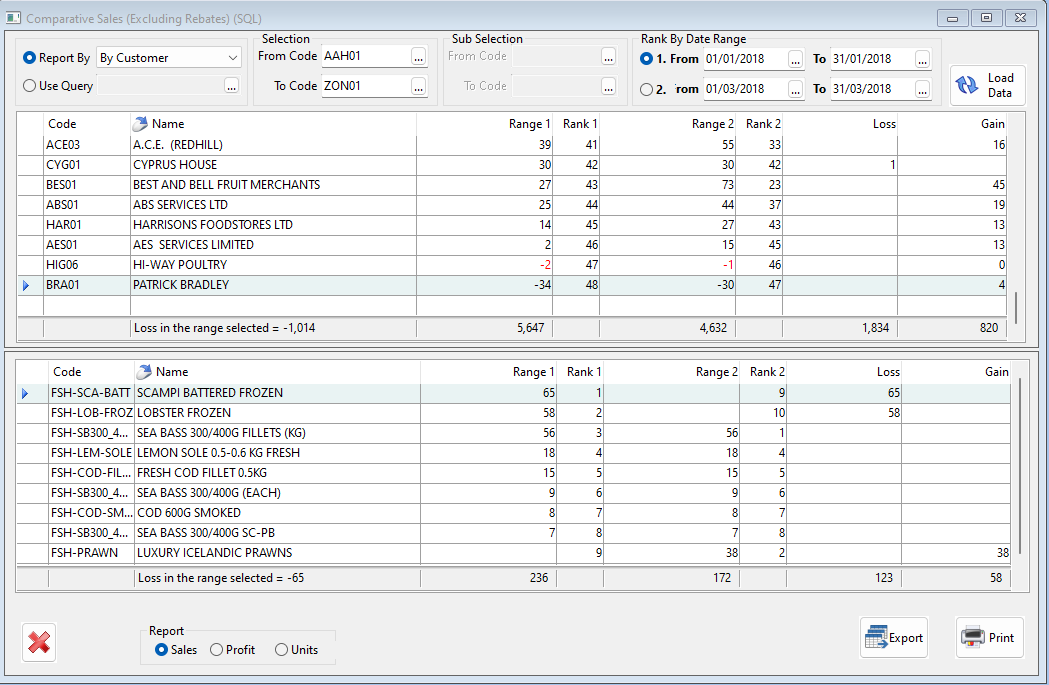
To get this grid you go to Sales analysis > comparative analysis Grid and then you enter in the two date ranges, there is different filters for example report by customer, product, market code etc… , and if you want to see the sales, profit or units.