How to use the Nominal Trend Analysis grid
The nominal trend analysis grid was introduced in Season 24. If you have an older version of Season Office, this feature will not be available to you. If you have used the Sales trend analysis grid, this one functions in a similar way.
Running the Nominal trend analysis report
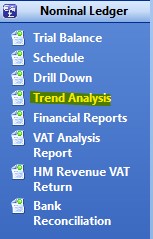
You can find the trend grid on your left hand Analysis menu, under the Nominal Ledger section.
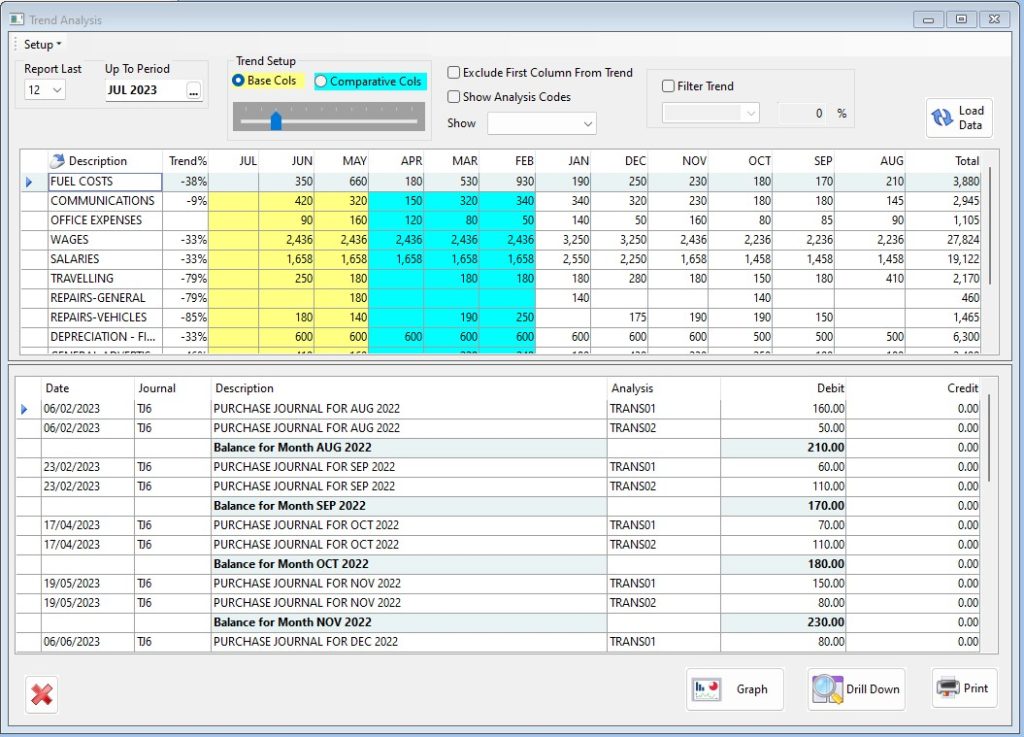
On the above grid, you have several options for generating your report.
- Report Last – This gives you the ability to show anywhere from 4 to 12 months worth of nominal data within the lower grid of the report window. The lower grid is where you see the more detailed breakdown of the nominal code you have selected on the upper grid.
- Up to Period – This is to select the month(period) that you wish to view data up to, you wont see any data from periods after what you have selected.
- Trend Setup;
- Base Cols – This will be the number of columns(months) you want to compare with comparative columns(months)
- Comparative Cols – This will be the number of columns(months) you want to compare the base cols(months) against
- For example, you may want to compare the last 3 months with the 3 months prior to that. For this you would set you base cols to 3 and your comparative cols to 3. The report will then look at the total of the 3 base months as well as the 3 comparative months and give you a trend%. If the base total is higher than the comparative total then you will see a positive%, if they are lower, it will be a negative%.
- Exclude first column from trend – This will exclude the most recent month from the trend calculation. If you were running 3 base cols up to the current period with this option selected, the report would exclude the current month and use the 3 month prior as your 3 base cols.
- Show Analysis Codes – This will switch the upper grid display to show the analysis codes associated with a particular nominal code rather than the nominal code itself.
- Filter Trend – The drop down menu allows you to select greater than or less than and then you have a field to enter a %figure. This can be used to filter the results to only show you nominal codes with a trend% less than or greater than the %figure you have entered.
To generate the report data, once you have selected what you need from the above options, click the Load Data button found in the top right of the report window.
Additional Options
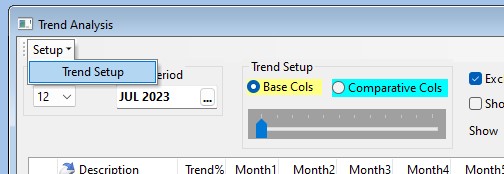
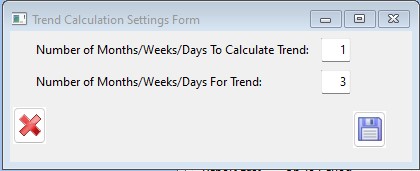
Setup Menu – From this drop down menu, you can select Trend Setup. This opens a new window with a couple of options. These allow you to set a default number of base and comparative columns so that when you open the report, it will always default to the number of base and comparative columns you have set up here.
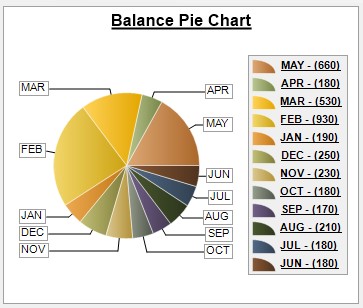
Graph – You will find a graph button at the bottom of the report window.
Drill Down – This is a shortcut to the nominal drill down grid if you need to look into the data in more detail after review the trend data.
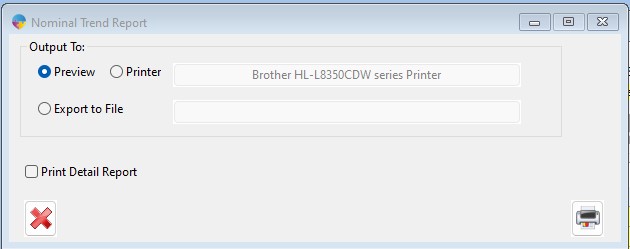
Print – This allows you to print the on screen grid data to a screen preview or a physical printer. The report will print in summary form by default. If you want to print the detail version, there is a check box within the print window for it.